
A hitchhiker’s guide to quantitative energy studies
Department of History and European Ethnology, University of Innsbruck, Austria
The author thanks Ute Hasenöhrl for fruitful discussions and two anonymous referees for their helpful comments on an earlier version of this paper. This paper is based on a comprehensive quantitative cross-country analysis of energy transitions where these three specific datasets have been used (Irene Pallua, “Historische Energietransitionen im Ländervergleich: Energienutzung, Bevölkerung, Wirtschaftliche Entwicklung”, Social Ecology Working Paper 148, IFF-Social Ecology, 2013).
The increasing digitisation and availability of energy data facilitates their application in research and teaching, but also requires careful source criticism, due to the variety of methodological conventions. This paper introduces the basic principles of quantitative energy studies. After some general remarks on using and interpreting energy data, three open access databases of particular usefulness to energy historians are scrutinized as to their theoretical and methodological approaches. The paper closes with reflections on the value of energy statistics for historical studies, advocating a careful combination of quantitative and qualitative sources.
Energy Transitions and Quantitative Data
Over the last 250 years, Western societies shifted their energy base from traditional non-fossil energy sources such as biomass and hydropower to fossil energy. This protracted process is generally referred to as “energy transition”. According to Vaclav Smil, the term “is used most often to describe the change in the composition (structure) of primary energy supply, the gradual shift from a specific pattern of energy provision to a new state of an energy system.”1 In the last three decades, historians as well as scholars from neighbouring disciplines have published a growing number of studies on historical energy transitions, focussing on changes of national energy systems within specific socioeconomic and political contexts. These studies are often based on data on the primary energy consumption of individual nations (or nation groups). This data is utilized to investigate and illustrate quantitative aspects of energy transitions, in particular historical turning points when an energy source gains relative dominance, as depicted in figure 1.2
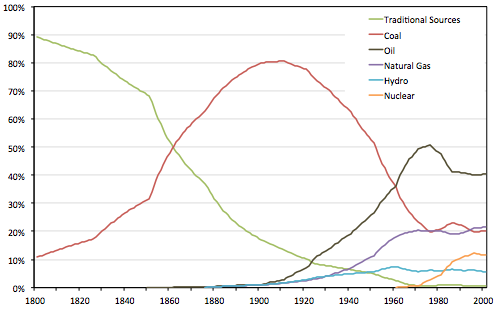
Data from Arnulf Grubler, "Energy Transitions" in Cutler J. Cleveland (ed.), Encyclopedia of Earth (Washington D.C.: Environmental Information Coalition, National Council for Science and the Environment, 2008, updated 2013, online version, accessed on March 11, 2018.). For a more detailed discussion and interpretation of this data see Arnulf Grubler, "Energy Transitions Research"
For a quantitative history of energy transitions, energy data covering a significant period of time is an indispensable source. While energy data on the post-Second World War period is accessible on websites of various national statistical offices and international organisations (International Energy Agency, the World Bank, the European Union, the OECD or the United Nations), empirically sound data on earlier time periods is not so readily available. Because of this, scholars investigating historical energy transitions have begun to compile their own datasets, resorting to a variety of sources ranging from official statistical accounts, comprehensive statistical works3, information from individual “energy producers” (e.g. coal mines), to primary and secondary literature. Similar to written sources, statistics are contextually produced, reflecting specific spatial and temporal frameworks. More generally speaking, numbers are not at all neutral.4 Therefore, the retrospective compilation of a database implies correcting (and producing to some extent) different bias.5
Besides these general problems of historical statistics, working with energy statistics has additional – and very specific – pitfalls, which will be addressed in the first part of this article. The second part then portraits three essential energy databases, which provide data for over 30 countries in total and could be helpful for scholars of energy history, analysing the included countries. Criteria for choosing these databases were unrestricted access, the presence of long-term data, and extensive country coverage. In the concluding remarks of this paper, the overall value of this data for energy history will be assessed.
Back to topWorking with Energy Statistics: Pitfalls and Caveats
One of the most important methodological tasks of historical science is source criticism. It is vital to understand the language of the source, its forms, and formulas and their background. This holds true for written sources, images, objects and numbers. As medieval historian C.R. Cheney phrased it, they “(…) only speak when they are spoken to, and they will not talk to strangers.”6 Thus, it is often necessary to apply knowledge from other disciplines, to work adequately with specific sources. The following paragraphs present some knowledge from the natural sciences, that is regarded as helpful for understanding energy and, additionally, they address possible pitfalls, such as the level of measurement and the quantification of electricity. Finally, specific energy units, conversion factors and calorific values are discussed.7
To understand energy and its value for society and the economy, we have to enter the world of physics, or more precisely, thermodynamics. According to the first law of thermodynamics, the total amount of energy in an isolated system is always constant (conservation of energy states). Thus, energy can neither be created, nor can it be destroyed – it can only be converted. The second law of thermodynamics deals with spontaneous change in the energy distribution. Energy can only be converted if the entropy of the system increases. As a result, every conversion is accompanied with “losses” i.e. undirected energy is released (e.g., waste heat) that can no longer be transformed into useful work. The amount of the energy convertible in useful work is named exergy and it decreases when energy is converted. Energy consumption in this sense means that the energy bound in energy carriers is converted into an "inferior" form of energy, an irreversible process. Thus, the second law of thermodynamics imposes physical restrictions to societal utilization of energy – it is not infinitely transformable into useful work.
Energy accounting frameworks, such as the energy balances published by international bodies like the International Energy Agency (IEA), United Nations, Eurostat8 or national statistical offices are closely linked to these concepts. They account for “energy flows” in a given unit of time (e.g. a year), which can generally be defined as the throughput of energy required for sustaining a relevant socioeconomic unit of analysis. The unit under study has to be defined and clearly delineated.9 The main flows are – somewhat simplified – energy production (extraction, capture or manufacturing of fuels or energy in a national territory ready for further transformation or societal use), energy imports (energy flows energy entering the national territory) and energy exports (energy flows leaving the national territory).10 Energy balances account for these flows and reflect three levels of measurement, where the level of exergy decreases from one to another:
- “Primary Energy” refers to all energy in that form as it is extracted from the natural environment, including coal, crude oil, geothermal heat, natural gas, nuclear heat, water, wind power and wood. Adding net imports to domestic extraction, the related and widely used indicator TPES "total primary energy supply” expresses the available amount of “raw energy” for the provision of energy needed in a society. While some primary forms, like natural gas for heating purposes are delivered directly to users, primary energy is usually converted into final energy. As explained above, these conversions are always subject to loss. The lower the loss, the higher the efficiency of the conversion technology, but it cannot be reduced to zero.
- “Final energy” is defined as energy directly reaching end-users such as agriculture, trade, services, public administration, transport and industry, or households, but excluding the energy transformation sector (e.g. power plants, refineries). Examples for final energy are diesel, gasoline or heating oil, coke, town gas and electricity. Final energy can also be imported or exported. Final energy consumption becomes relevant if energy use is investigated at the sectoral level.
- “Useful energy” refers to the energy that becomes effective in the provision of energy services, such as light or heat. In this context, the efficiency of technical engines plays a key role.
When using or interpreting energy data it is very important to consider the level of measurement in which it is given, otherwise this might lead to misinterpretations. Due to the mentioned “losses”, the difference, for example, between TPES and final energy is around 30 percent.11
Another source of ambiguity that needs to be assessed properly when working with energy data is the quantification of electricity. Electricity, as a secondary energy form12, can be generated from a variety of primary energy sources. In order to avoid double counting, the IEA and the OECD apply the following standardized logic: only the first energy form (primary energy) used to produce electricity is accounted for, rather than the amount of electricity generated by a power plant (e.g. the energy input in a fossil-fuelled thermal power plant). That is why only electricity generated from nuclear heat, hydropower, geothermal, or solar heat is taken into account in total primary energy supply and not electricity generated from fossil fuels (see fig. 1, where only the share of nuclear heat and hydropower are depicted). However, data on final energy consumption, for example, includes the total amount of electricity generated from all types of energy. Since various methods for calculating primary electricity from non-combustible sources exist13, one should always be aware which convention on the quantification of electricity is used when comparing, interpreting or compiling energy data –these conventions can vary across sources and lead to considerably different outcomes. One method recommended and applied currently by the United Nations Statistics division and the IEA is the “physical energy content method”, where the energy content of the primary energy source is accounted for. For electricity production from non-combustible resources, heat input is estimated based on assumed conversion efficiencies of 33% for nuclear and concentrating solar, and 10% for geothermal. Thus, the total energy expenditure required to produce a certain amount of energy from nuclear fission is about three times higher than the energy content of the generated electricity. This method has replaced the “partial substitution method” for calculating primary electricity from non-combustible resources, which was used by IEA in the past.14
There is another difficulty when working with energy data, especially when compiling them: they can be expressed in different units. According to the International system of units, established in 1960, the unit for energy is Joule. However, not all energy data is given in this unit. Alternatives that could be used in energy statistics are, for example, tons of oil equivalent (toe), Kilowatt-hours (Kwh) or British Thermal units (Btu). When confronted with different units it is important to convert data into a common unit, favourably into Joules and its multipliers Megajoule (MJ, 106 J), Gigajoule (GJ, 109 J), Terajoule (TJ, 1012 J) or Petajoule (PJ, 1015 J) (see table 1)
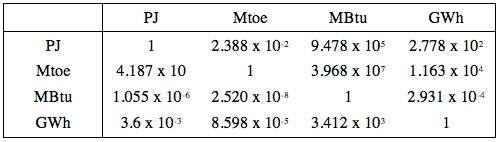
IEA, Key World Energy Statistics (Paris, 2017), 70. A unit converter provided by OECD/Eurostat can be found at http://www.interenerstat.org/converter.asp, accessed on Dec. 16, 2017.
Moreover, sometimes energy is accounted as commodity and values are shown in the original units of measurement, e.g. mass units (kilogramme or tonne) for solid fuels and volume units (e.g. litres –often converted in intermediary units, such as barrels– or cubic metres) for liquids or gaseous fuels. The average conversion factors used to transform this values into Joule only partially reflect the spatial or temporal variability of the calorific value of energy sources15 and certain flaws can therefore not be ruled out.
Another source of misinterpretations can be the most relevant property of a combustible energy source: its calorific value. There are two conventions used in energy statistics, namely the net (NCV) and the gross calorific values (GCV), where the latter also includes the condensation heat produced during combustion of the fuel measured under laboratory conditions. Generally, NCV is about 5 to 6 percent less than GCV for liquid and solid fossil fuels and about 10 percent for natural gas.16 Hence, it is vital to know which calorific value is used, when compiling or interpreting energy data.
Back to topEnergy Databases
As the preceding section has shown, compiling energy datasets is not at all a straightforward task. Fortunately, scholars working on historical energy transitions have compiled databases, which can be of interest for historians working on energy history. In the following paragraphs, three open access databases covering a period of at least 150 years are introduced as sources for research on energy transitions. (1) The Podobnik energy dataset, which covers 27 countries from all continents and was compiled at the end of the 1990s; (2) the data collection elaborated in the Global Energy Project of the Joint Seminar of History and Economics and the MIT Research Group on History, Energy, and Environment covering 11 countries with a regional focus on Europe and the Americas; and (3) the data collection of the Viennese Institute of Social Ecology, focussing on industrialized countries, the city of Vienna as well as on the global level. While Podobniks’ energy dataset comprises only modern commercial energy sources, the other two datasets also include biomass as an energy source, but adopt different definitions of societal relevant biomass flows. The basic logic to calculate primary energy consumption applied in all the three datasets is adding up domestic energy production, energy imports and subtracting energy exports.
In general, a quality indicator for such databases is a concise but accurate description of sources and methods, allowing users to understand the underlying assumptions and methodologies that largely depend on the research direction and the disciplinary focus of its authors. Such guidelines are provided in (2) and (3), while (1) lacks a comprehensive technical introduction.
The Podobnik Energy Dataset
The Podobnik Energy dataset17 consists of a single Excel-file and was published in 2011 on the website of the Knowledge Network for Energy Transitions by Cutler J. Cleveland. Physical quantities of primary energy production, trade and consumption as well as population and GDP data18 are presented for 27 selected countries around the globe covering (to varying degrees) the period from 1800 to 1997. This dataset was originally compiled by the sociologist Bruce Podobnik and used in his book “Global Energy Shifts: Fostering Sustainability in a Turbulent Age”19 as a quantitative background for his analysis on global energy shifts, in correlation with geopolitical rivalry, corporate competition and social conflicts.20
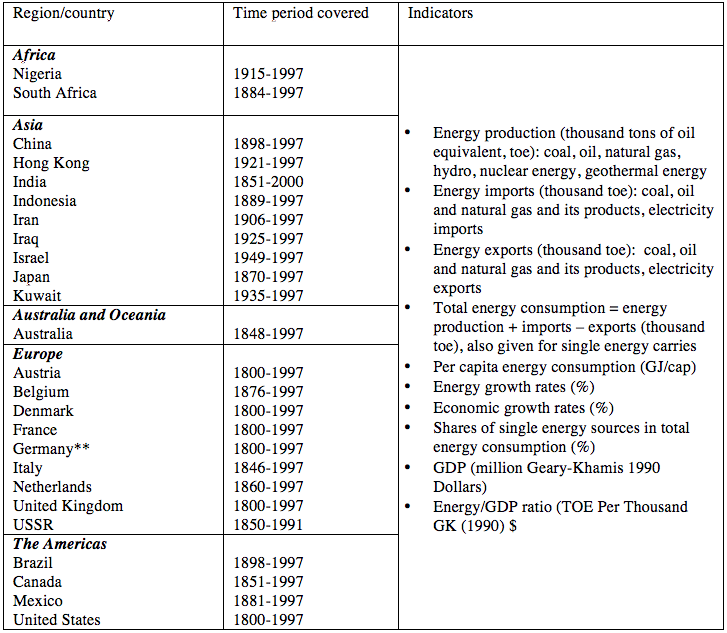
** Data for Germany from 1946 to 1990 can be found in the spreadsheets “East Germany” and “West Germany”.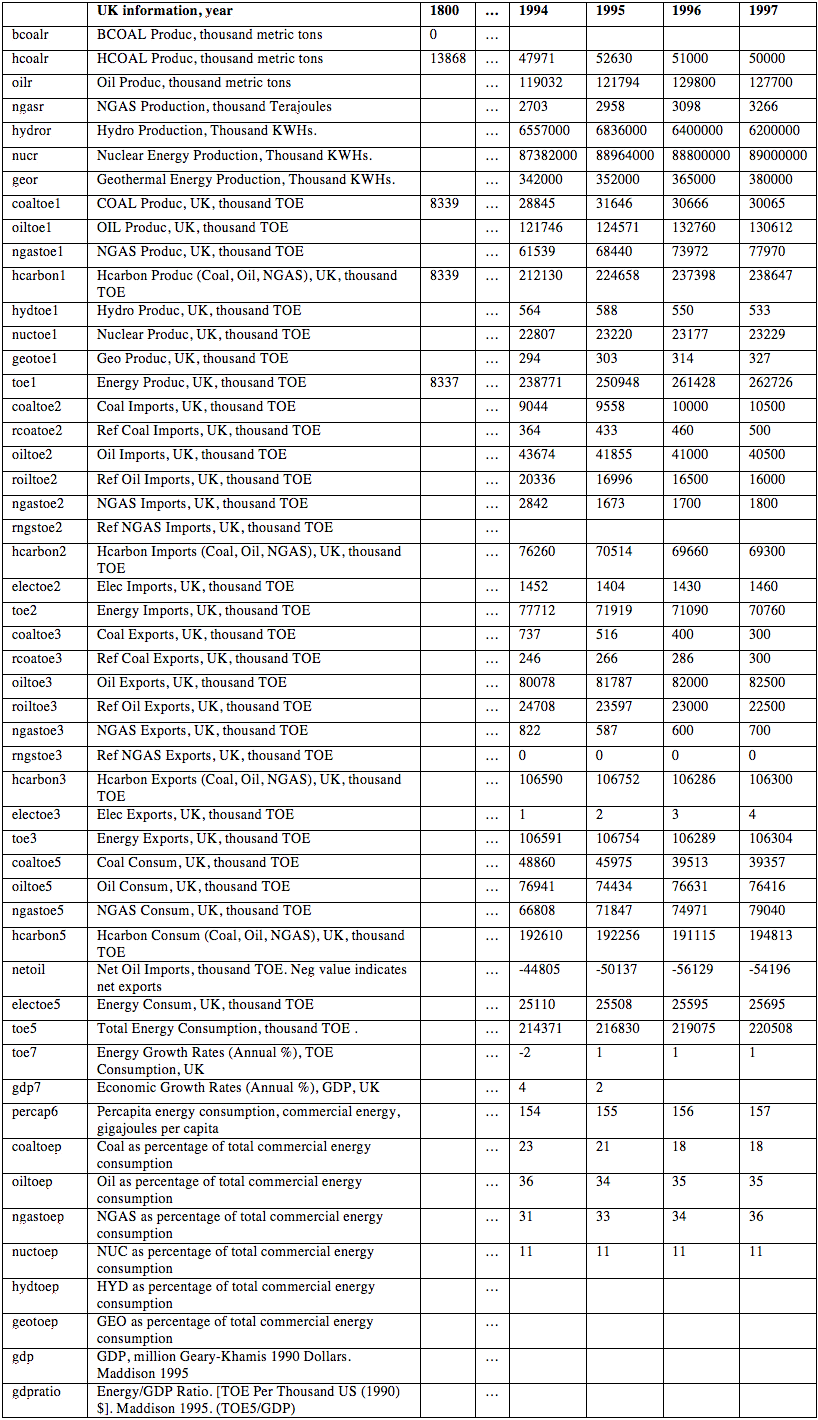
The database comprises the production of hard and brown coal, oil (in metric tons and tons of oil equivalent (toe21)), natural gas (in Terajoules (Tj) and toe) and electricity produced in hydropower plants, as well as in geothermal and nuclear power plants (kilowatt-hours and toe)22. Data on trade with fossil fuels and electricity is missing for early years and included from 1925 onwards only. As primary energy consumption is usually calculated as the sum of domestic energy +/– traded energy, energy consumption before 1925 might be underestimated. Additionally, there are data gaps for the period of World War II. The aggregated indicators “total energy consumption” (given in tons of oil equivalent), and “energy consumption per capita” (Gigajoules), percentage of individual energy sources in total energy consumption as well as energy and GDP growth rates and the “Energy/GDP ratio” (toe per Thousand US (1990) $) are provided.
The data is based on the following sources:
- For 1800 to 1949, data is mainly retrieved from the statistical reference books published by Bouda Etemad and Jean Luciani on the one hand, and Brian R. Mitchell on the other hand,23 various publications of Great Britain’s Statistical Office and The US Department of Commerce.
- For the period of 1950-1997, data was retrieved from the Energy Statistics Yearbooks published yearly by the United Nations.
Podobnik used the method of linear interpolation to close data gaps. To increase the reliability of this database, the author has performed comparisons and crosschecks with other data sources, such the IEA database.24 However, detailed methodological explanations are missing. Therefore, it is not clear how the data from multiple sources have been harmonised. The following questions arise in particular: Which conversion factors have been applied? How is primary electricity calculated? To be on the safe side, data needs to be compared and cross checked with other sources. Furthermore, due to its multiple content, the dataset is rather unintuitive in its structure and handling.
The Global Energy Project’s National Energy Accounts
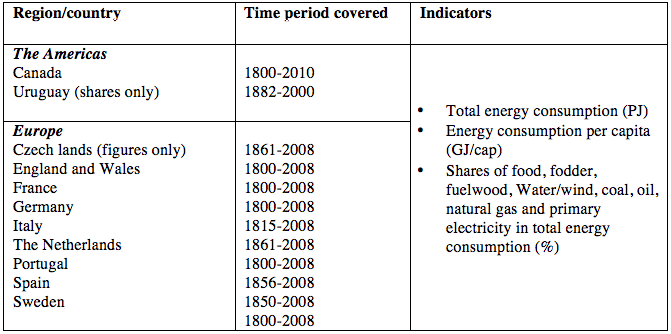
This database25 covers national energy consumption data for 11 European and American countries. Originally developed within the Energy and Growth group26 during 2002_2011, data has been added and revised recently. The database is also expected to be supplemented in future. Data was used in several publications to reveal the interrelations between economic development and energy use and the important role technology and efficiency gains played in energy transitions.27
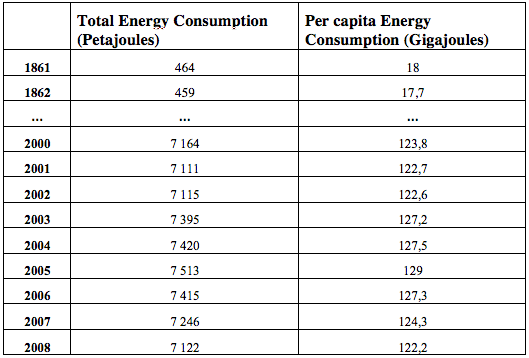
a) Per capita energy consumption and total consumption in Italy
Source: Malanima, Paolo, Energy consumption in Italy, 1861-2000, CNR (2006).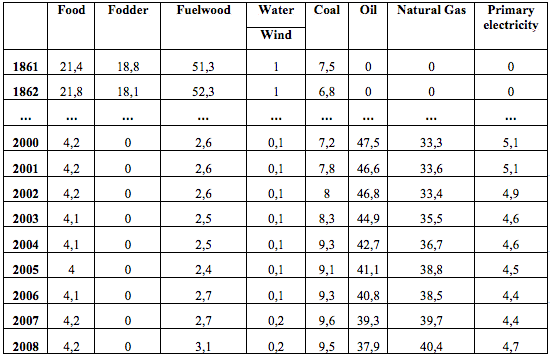
b) Shares of energy consumption in Italy 1861-2008 (%)
Source: Malanima, Paolo, Energy consumption in Italy, 1861-2000, CNR (2006).
The database distinguishes not only between modern energy (coal, oil, natural gas) and primary electricity but, in contrast to the Podobnik energy dataset and official energy statistics, also includes biomass (food, fodder, fuelwood) and, for some countries, wind and water power as traditional energy sources. Energy flows are taken into account only when they imply costs or efforts.28
The data covers the period from 1800 to the first decade of the 21st century and the authors compiled it using a conjoint and largely standardized methodology. However, some small differences exist in calculation methods applied to capture traditional water and wind power as well as biomass, but these slight inconsistencies do not change the overall picture. The data can be downloaded as Excel files containing two spreadsheets, covering (a) total energy consumption (Petajoules) and energy consumption per capita (Gigajoules) and (b) shares of different energy sources in total energy consumption (%). The given shares allow to calculate and compare actual energy flows of different traditional and modern energy sources. Energy imports and exports are not listed separately but can be found in the data appendixes of the related country studies.29 The data files are organized in a consistent fashion and include a short methodological description. Moreover, data visualisations are provided on the website. This database is methodologically consistent with the IEA energy balances, ensuring comparability and possibilities for further extension of data.30 Most data on fossil fuel and electricity has been compiled based on official statistics.31 Primary electricity includes hydro-, geothermal and nuclear power as well as renewable sources, except electricity generated from biomass.
Much effort has been devoted to a re-evalution of firewood consumption, since it is often underestimated in official statistics.32 Due to this painstaking work, data is more accurate and reliable here than in official statistics, which usually include only commercially used fuelwood.
In contrast to the theoretical framework underlying conventional energy statistics, where only energy convertible by technical artefacts (machines) is included, the contributors’ concept of societal energy consumption varies significantly from the one reflected in official energy statistics or other scholarly work.33 Working animals and human beings are understood as “biological converters” or living machines in this context;34 they convert chemical energy into mechanical energy, which can be used to perform socio-economically valuable work. Therefore, energy used for human nutrition35 and food for draught livestock, like oxen and horses, is included in this dataset representing a significant energy flow in preindustrial societies. In order to calculate these energy flows, a consumption-based approach has been used. Based on a “benchmark value” calculated from an average per capita calorie consumption for different years, they extrapolate this value to the entire area using the respective population data.36 The same approach is applied to calculate feed for working animals: depending on feed requirements of different categories of animals with regard to their height, weight and workload, this energy flow is extrapolated with the total number of the respective working animals.37
The Data Collection of the Viennese Institute of Social Ecology (SEC)
This data collection38 includes energy flow data on a global, national and local scale. Krausmann and colleagues compiled the datasets during the last decade39 covering the period from the 19th to the 21st century. The data is organised in Excel-files in a consistent way, providing an in-depth description of sources and accounting methodologies for each individual data set. Data has been sourced pre-eminently from national statistical offices. In terms of quality and accurateness this database is comparable with the above described National energy accounts, and in principle, also the accounting logic of the two databases, since its originators widely follow the IEA guidelines for energy accounting. However, differences exist in the treatment of biomass and the applied calorific values, which are rooted in the differing theoretical concepts of both “schools”.
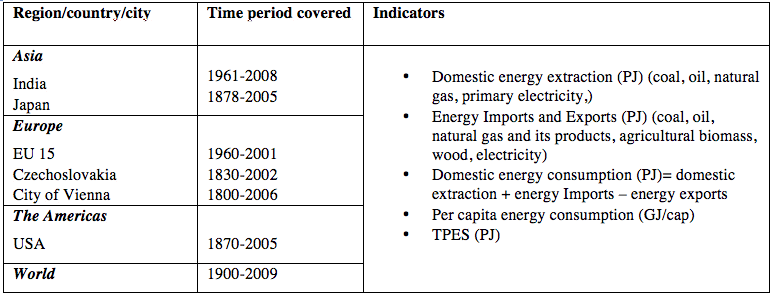
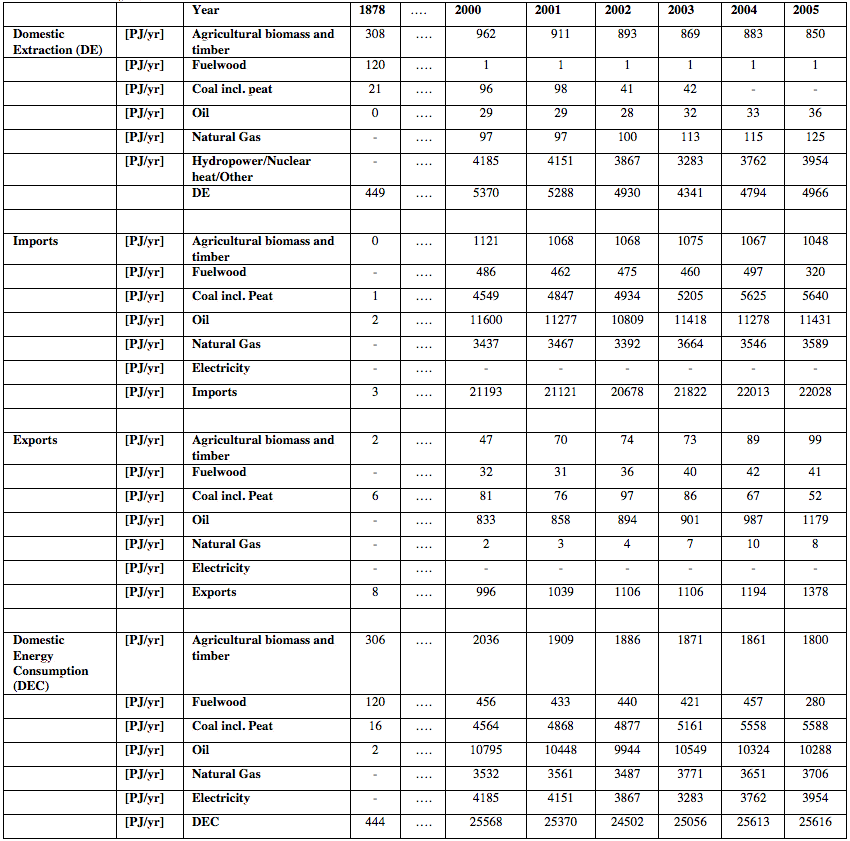
Primary energy flows by main energy types, 1878 to 2005
Methods and sources: see technical notes and Krausmann et al. 2011
Unit: PJ/yrs
The authors provide data reflecting their background in social ecology, an interdisciplinary field bridging natural sciences with social sciences and the humanities. Its core axiom is that societal and biophysical systems interact, co-evolve and impact upon each other. “Social Metabolism” is a fruitful concept to analyse these interrelations40, applicable on every spatial and temporal scale; its related methodology of material and energy flow analysis (MFA41 and EFA42). MFA and EFA allows taking into account all material / energy flows extracted from the biophysical environment that enter a defined socioeconomic system as an input. All material and energetic inputs are transformed and used within the socioeconomic system to build up or maintain its biophysical stocks (human population, livestock, infrastructure and long living artefacts). The residues are crossing the border between the socioeconomic system and the biophysical environment again as unwanted “output” in form of wastes and emissions.43
The provided data collection includes coal, oil, natural gas given as gross calorific value (GCV) and primary electricity44 in Joules and additionally, biomass flows that are considered as societal relevant energy flows. Biomass in the socioecological understanding does not only comprise biomass used for building and maintenance of infrastructure and artefacts, but also for human and livestock reproduction. The inclusion of biomass flows might be regarded as a similarity with the Global Energy Project’s National energy accounts. However, the accounting concept is based on different theoretical assumptions and, in consequence, a different methodology. While the national accounts include only biomass used for energetic purposes (food, fodder, and fuelwood), biomass flows covered in EFA are more comprehensive. In analogy to the accounting concept of energy balances, all biomass flows through a socioeconomic system are regarded as primary energy. Moreover, biomass used for human nutrition is understood as final energy.45 Therefore, primary energy includes the total amount of harvested biomass as well as grazed biomass.46 This comprehensive and harmonized accounting scheme and its derived indicator domestic energy consumption (DEC) allows to go beyond the spatial or temporal scale of an industrialised society, which is certainly a shared asset with the National energy accounts described above. Hence, it can be applied for analysing transitions from a biomass-based and predominant agrarian to fossil fuel based industrial socioeconomic system. While this indicator measures energy use in a defined socioeconomic system, it can also be interpreted as its emission potential. Generally, it can be linked to socioecological indicators (e.g. human appropriation of net primary production, HANPP47), resource efficiency indicators, as well as to economic and demographic indicators.
Back to topConcluding Remarks
The paper introduced some basic concepts of energy and energy accounting, drawing attention on possible uncertainties. Awareness of different conceptual and accounting methodologies helps energy historians to utilize or interpret historical energy data or to compile their own datasets. The following questions are important for an appropriate treatment of such sources: Which level of measurement (primary energy, final energy, useful energy) is reflected in the data? What is the basic convention for accounting of electricity? Which conversion factors have been used? Shedding light on these pitfalls is vital, and will facilitate the analysis of the data and prevents misinterpretations. One should keep in mind that, in general, historical statistics have their limitations, such as reliability, varying definitions of indicators over time, or changes of national borders, which might not always be reflected in the choice of data.
Nevertheless, compiling databases, as the ones described in the second part of this paper, and publishing them online, thus allowing access to interested scholars is an important effort that deserves immense recognition. However, an in depth knowledge of the content and quality of the applied datasets is needed, when utilizing them. The Podobnik energy dataset includes only modern energy sources, like fossil fuels and primary electricity generated from hydropower, nuclear and geothermal heat, and is only suitable for analysing “modern” energy transitions, e.g. from coal to oil. The dataset provided by the Global Energy Project and the data collection of the Institute of Social Ecology are more comprehensive and include also biomass as a traditional energy source, but applied methodologies differing from each other. Nevertheless, with this data it is possible to delineate the historical energy transition from biomass to fossil fuels and electricity.
Quantitative data can be used as a valuable source for historical energy studies, especially if they are intended to describe historical trends on an aggregate level. Studies of this kind mostly choose a macro perspective: focussing on the timing of energy transitions, correlating the energy data with economic data and/or technological change48 or data on social upheavals and geopolitical changes49 or analysing sustainability problems of past and present energy systems.50 These datasets are especially useful for describing structural changes in energy systems; they show clearly when they occured but not how. As data alone can never tell the whole story, it is recommended to combine it with qualitative sources to expand the overall picture – especially to trace the histories and roles of actors involved in energy transitions, in order to assess the multiple dimensions of energy history.
- 1. Vaclav Smil, Energy Transitions: History, Requirements, Prospects (Santa Barbara, Calif.: Praeger, 2010), vii. For alternative definitions, see Benjamin K. Sovacool, "How Long Will It Take? Conceptualizing the Temporal Dynamics of Energy Transitions", Energy Research & Social Science, vol. 13, 2016, 202-203.
- 2. E.g. Roger Fouquet, “Historical Energy Transitions. Speed, Prices and System Transformation”, Energy Research & Social Science, vol. 22, 2016; Arnulf Grubler, "Energy Transitions Research: Insights and Cautionary Tales", Energy Policy, vol. 50, 2012; Irene Pallua, Historische Energietransitionen im Ländervergleich, 75-104 (cf. note 1).
- 3. E.g. Brian R. Mitchell, International Historical Statistics: 1750-2005 (Basingstoke: Palgrave Macmillan, 2007); Bouda Etemad, Jean Luciani, World Energy Production, 1800-1985: Production mondiale d'énergie, 1800-1985 (Genève: Librairie Droz, 1991).
- 4. Pat Hudson, Mina Ishizu, History by Numbers: An Introduction to Quantitative Approaches, (London, Oxford, New York, New Delhi, Sydney: Bloomsbury Academic, 2017), 1.
- 5. Other issues with historical statistical data include its incompleteness and/or fragmentation, changing definitions or alternating units of measurement. Therefore, they have to be interpreted with care. Such precautionary recommendations can be found e.g. in the introduction of Brian Mitchells seminal compilation of historical statistics (Brian R. Mitchell, International Historical Statistics, op. cit., vii-ix).
- 6. Christopher Robert Cheney, The Records of Medieval England: An Inaugural Lecture (Cambridge, UK: Cambridge University Press, 1956), 11.
- 7. This section makes no claim to completeness. It is only intended to give some insights into the matter of energy statistics. As the section refers to the methodology used by international bodies in particular, it is further strongly recommended to always crosscheck the methodology adopted for compiling the specific energy data that will be used.
- 8. IEA, "Energy Balances Statistics", available at http://www.iea.org/statistics/topics/energybalances/, accessed Dec. 16, 2017, Eurostat, "Energy Balances", available at http://ec.europa.eu/eurostat/web/energy/data/energy-balances, accessed Dec. 16, 2017.
- 9. In energy history, nation states are often of particular interest, but also other units of analysis are certainly conceivable, depending on the research focus: regions, cities, specific economic sectors, like the building sector, industry, or even a household. Applying a macro perspective, energy flows can be described as energetic exchange between society and the environment. Energy harvested from energy rich raw materials (fossil fuels, biomass, and uranium) and non-combustible “new” renewables (e.g. wind, geothermal heat, solar energy,) enters a socioeconomic system. During and after been “consumed”, corresponding outputs, like emissions or waste heat, can provoke several environmental impacts, like global warming.
- 10. More details can be found in United Nations Statistics Division, "International Recommendations for Energy Statistics (IRES)", available at https://unstats.un.org/unsd/energy/ires/IRES-web.pdf, accessed Dec. 16, 2017, 56-58.
- 11. According to the IEA, global TPES in 2015 was 13,647 Mtoe, while global final energy consumption was only 9,384 Mtoe (IEA, "World Energy Balances: Overview 2017", available at http://www.iea.org/publications/freepublications/publication/WorldEnerg…, accessed Dec 16, 2017).
- 12. Secondary energy is transformed primary energy. Apart from electricity, other examples include petrol, gasoline or heating oil, that derive from processing crude oil, or coke and briquettes that are manufactured from coal.
- 13. E.g. Subhes C. Bhattacharyya, Energy Economics: Concepts, Issues, markets and governance (London, New York: Springer, 2011), 27-28; United Nations Statistics Division, International Recommendations for Energy Statistics (IRES), 103-104 (cf. note 12).
- 14. With this method, the primary energy equivalent was calculated as the hypothetical amount of energy needed in a thermal power plant to generate the same amount of electricity. It was abandoned, however, due to difficulties in calculating the energy balance (Id.)
- 15. Country specific conversion factors, if available in the methodological description of (historical) official energy accounts, should be used. For a general introduction of conversion factors used for compiling energy statistics and balances see United Nations Statistics Division, International Recommendations for Energy Statistics (IRES), 45-54 (cf. note 12), for default calorific values of specific energy sources and products see ibid., 48-50.
- 16. OECD, IEA, Eurostat, Energy Statistics Manual (Paris, 2005), 20. The Internationals Energy Agency uses the NCV in its energy balances (IEA, Key World Energy Statistics, 71 (cf. note 17); IEA, World Energy Balances (Paris: IEA, 2017).
- 17. Data can be retrieved from http://www.digitaluniverse.net/energytransitions/topics/view/51cbfc90f7…
- 18. GDP and Population are taken from Angus Maddison, Monitoring the World Economy, 1820-1992 (Paris: OECD Development Centre, 1995). The latest release of this database is available on http://www.ggdc.net/maddison/maddison-project/home.htm accessed on Dec. 12, 2017.
- 19. Bruce Podobnik, Global Energy Shifts: Fostering Sustainability in a Turbulent Age (Philadelphia, Pa.: Temple Univ. Press, 2006). See also Bruce Podobnik, "Toward a Sustainable Energy Regime", Technological Forecasting and Social Change, vol. 62/3, 1999 and "Global Energy Inequalities: Exploring the Long-Term Implications", Journal of World-Systems Research, vol. VIII/2, 2002.
- 20. Bruce Podobnik, Global Energy Shifts, op. cit., 1-17.
- 21. One ton of oil equivalent is defined as the amount of energy released by burning one tonne of crude oil.
- 22. In his book, Podobnik presented data on fuelwood and alternative energy sources that is not included in this dataset.
- 23. Bouda Etemad, Jean Luciani, World Energy Production, 1800-1985, op. cit;, Brian R. Mitchell, British Historical Statistics (Cambridge: Cambridge University Press, 1988) and International Historical Statistics (different volumes) (Basingstoke: Palgrave Macmillan, 2007) can be regarded as a valuable source for historical statistics on energy production and trade, too.
- 24. Bruce Podobnik, Global Energy Shifts, op. cit., 169–173.
- 25. Data can be retrieved from https://sites.fas.harvard.edu/~histecon/energyhistory/energydata.html
- 26. Most members of this group have a disciplinary background in economic history
- 27. Data has been utilized inter alia in Ben Gales, Astrid Kander, Paolo Malanima, Maria del Mar Rubio, "North Versus South: Energy Transition and Energy Intensity in Europe over 200 Years", European Revue of Economic History, vol. 11/02, 2007,; Sofia Henriques, Energy Transitions, Economic Growth and Structural Change: Portugal in a Long-run Comparative Perspective (Lund: Lund University, 2011), 54; Sofia Teives Henriques, Energy Consumption in Portugal: 1856-2006 (Naples: Istituto di Studi sulle Società del Mediterraneo, 2009); Astrid Kander, Economic Growth, Energy Consumption and CO2 Emissions in Sweden 1800-2000 (Stockholm:Almqvist & Wiksell International , 2002); Astrid Kander Paolo Malanima Paul Warde (eds.), Power to the People: Energy in Europe over the Last Five Centuries (Princeton: Princeton University Press, 2013); Paul Warde, Energy Consumption in England and Wales, 1560-2000 (Naples: Consiglio Nazionale delle Ricerche, 2007).
- 28. Astrid Kander, Paolo Malanima, Paul Warde, Power to the People, op. cit., 18-20.
- 29. Sofia Henriques, Energy Transitions, Economic Growth and Structural Change, op. cit.; Astrid Kander, Economic Growth, op. cit.; Paolo Malanima, Energy Consumption in Italy in the 19th and 20th Centuries: A Statistical Outline (Naples: Consiglio Nazionale delle Ricerche, 2006); Paul Warde, Energy Consumption in England and Wales, 1560 -2000, op. cit. The group has recently begun to calculate embodied energy in traded goods. For sources and methods, see Paul Warde, "Energy Embodied in Traded Goods for the United Kingdom, 1870-1935. Discussion of Methods and Sources", available at https://histecon.fas.harvard.edu/energyhistory/British_energy_multiplie…, accessed Dec. 12, 2017);Sofia Teives Henriques, Paul Warde, "Fuelling the English Breakfast. Hidden Energy flows in the Anglo-Danish trade 1870–1913", Regional Environmental Change, vol. 18/4, 2018, 969-971.
- 30. Joint Center for History and Economics, Harvard University, "National Energy Accounts: Sources, Methods, and Citations", available at https://sites.fas.harvard.edu/~histecon/energyhistory/sources.html, accessed Dec. 12, 2017.
- 31. See the sources and methods sections in the publications cited in footnote 31 and 33.
- 32. See for example the model on firewood consumption developed for Sweden (Astrid Kander, Economic Growth, op. cit., 23-39 and Appendix D).
- 33. Arnulf Grubler, "Energy Transitions Research", art. cit. and Bruce Podobnik, Global Energy Shifts, op. cit.
- 34. Astrid Kander, Paolo Malanima, Paul Warde, Power to the People, op. cit., 37-56.
- 35. Plant based foods, as well as edible products of animal origin have been included in the calculation of this energy flow. Hence, all edible food that is available in a given year to the population of a country is accounted for as primary energy (e.g. Sofia Teives Henriques, Energy Consumption in Portugal, op. cit., 22).
- 36. Astrid Kander, Economic Growth, Energy Consumption and CO2 Emissions in Sweden 1800-2000, op. cit., 42; Paul Warde, Energy Consumption in England and Wales, 1560 -2000, op. cit., 23-32).
- 37. Paul Warde, Energy Consumption in England and Wales, 1560 -2000, op. cit., 40-45; Astrid Kander, Paul Warde, "Energy Availability from Livestock and Agricultural Productivity in Europe, 1815-1913. A New Comparison", The Economic History Review, vol. 64/1, 2011. For a description of sources and the methodology used, see Astrid Kander, Paul Warde, "Number, Size and Energy Consumption of Draught Animals in European Agriculture. Working Paper 2009", available at http://www.histecon.magd.cam.ac.uk/history-sust/files/warde_kander_work…, accessed Dec. 14, 2017.
- 38. The data is available on http://www.wiso.boku.ac.at/sec/data-download/.
- 39. Data has been published inter alia in Simron Jit Singh et al., "India's Biophysical Economy, 1961-2008. Sustainability in a National and Global Context", Ecological Economics, vol. 76, 2012, 60–69; Fridolin Krausmann, Simone Gingrich, Reza Nourbakhch‐Sabet, "The Metabolic Transition in Japan", Journal of Industrial Ecology, vol. 15/6, 2011; Helmut Haberl et al., "The Energetic Metabolism of the European Union and the United States. Decadal Energy Input Time-Series with an Emphasis on Biomass", Journal of Industrial Ecology, vol. 10/4, 2006; Petra Kuskova, Simone Gingrich, Fridolin Krausmann, "Long Term Changes in Social Metabolism and Land Use in Czechoslovakia, 1830–2000: An Energy Transition under Changing Political Regimes", Ecological Economics, vol. 68/1-2, 2008; Fridolin Krausmann, "A City and Its Hinterland: Vienna’s Energy Metabolism 1800–2006", in Simron Jit Singh et al. (eds.), Long Term Socio-Ecological Research: Studies in Society-Nature Interactions Across Spatial and Temporal Scales (Dordrecht: Springer Netherlands, 2013); Sylvia Gierlinger, Fridolin Krausmann, "The Physical Economy of the United States of America", Journal of Industrial Ecology, vol. 16/3, 2012; Fridolin Krausmann et al. "Growth in Global Materials Use, GDP and Population during the 20th Century", Ecological Economics, vol. 68/10, 2009.
- 40. For a theoretical and methodological overview, see Marina Fischer-Kowalski, Helmut Haberl (eds.), Socioecological Transitions and Global Change: Trajectories of Social Metabolism and Land Use (Cheltenham, UK, Northampton, MA: Edward Elgar, 2007); Helmut Haberl, Marina Fischer-Kowalski, Fridolin Krausmann, Verena Winiwarter (eds.), Social Ecology: Society-Nature Relations across Time and Space (Basel: Springer International Publishing, 2016)
- 41. The accounting principles of material flow analysis are widely used, for example by Eurostat. A methodological guide was published first in 2001 (Eurostat, Economy-wide Material Flow Accounts and Derived Indicators: A Methodological Guide (Luxembourg: Eurostat, 2001)) and complemented with various compilation guides (e.g. Helga Weisz et al. Economy-Wide Material Flow Accounting. A Compilation Guide (Luxembourg: Eurostat, European Commission, 2007); Eurostat, Economy Wide-Material Accounts (EW-MFA) (Luxembourg: Eurostat, 2013). For a concise methodological description see Nina Eisenmenger, "Method précis: Material Flow Analysis", in Helmut Haberl et al. Social Ecology, op. cit., 234–238 (cf. note 44).
- 42. A theoretical and methodological introduction was published by Helmut Haberl, "The Energetic Metabolism of Societies. Part I: Accounting Concepts", Journal of Industrial Ecology, vol. 5/1, 2001.
- 43. Marina Fischer-Kowalski, et al., "Methodology and Indicators of Economy-Wide Material Flow Accounting", Journal of Industrial Ecology, vol. 15/6, 2011.
- 44. The calculation of primary electricity is based on the following conversion efficiencies: 33 %for nuclear heat, 95 % for hydropower and 10 % for geothermal energy (Helmut Haberl, "Economy-Wide Energy Flow Accounting", in Heinz Schandl, Clemens M. Grünbühel, Helmut Haberl, Helga Weisz (eds.), Handbook of Physical Accounting.: Measuring Bio-Physical Dimensions of Socio Economic Activities. MFA - EFA - HANPP (Vienna: Federal Ministry of Agriculture and Forestry, Environment and Water Management, 2002) See also United Nations Statistics Division, International Recommendations for Energy Statistics (IRES), 103-104 (cf. note 12).
- 45. Helmut Haberl, "The Energetic Metabolism of Societies" (cf. note 46).
- 46. For a detailed description of the accounting methodology see Fridolin Krausmann, et al., "Global Patterns of Socioeconomic Biomass Flows in the Year 2000: A Comprehensive Assessment of Supply, Consumption and Constraints", Ecological Economics vol. 65/3, 2008; Fridolin Krausmann, et al., "Global Human Appropriation of Net Primary Production Doubled in the 20th Century", Proceedings of the National Academy of Sciences of the United States of America, vol. 110/25, 2013.
- 47. Helmut Haberl, "Human Appropriation of Net Primary Production", in Helmut Geist (ed.), Our Earth's Changing Land: An Encyclopedia of Land-Use and Land-Cover Change (Westport, Conn.: Greenwood Press, 2006), 292–294.
- 48. E.g. Astrid Kander, Paolo Malanima, Paul Warde, Power to the People (cf. note 31).
- 49. E.g. Bruce Podobnik, Global Energy Shifts, (cf. note 23), Bruce Podobnik, "Global Energy Inequalities" (cf. note 23).
- 50. E.g. Arnulf Grubler, "Energy Transitions Research" (cf. note 3); Sofia Teives Henriques, Karol J. Borowiecki, "The Drivers of Long-Run CO 2 Emissions in Europe, North America and Japan since 1800", Energy Policy, vol. 101, 2017, 537–549; Fridolin Krausmann, Marina Fischer-Kowalski, Heinz Schandl, Nina Eisenmenger, "The Global Sociometabolic Transition: Past and Present Metabolic Profiles and their Future Trajectories", Journal of Industrial Ecology, vol. 12/5-6, 2008,.
Bhattacharyya Subhes C., Energy Economics: Concepts, Issues, Markets and Governance (London, New York: Springer, 2011).
Cheney Christopher R., The Records of Medieval England: An Inaugural Lecture (Cambridge, UK: Cambridge University Press, 1956).
Eisenmenger Nina, "Method précis: Material Flow Analysis", in Helmut Haberl, Marina Fischer-Kowalski, Fridolin Krausmann, Verena Winiwarter (eds.), Social Ecology: Society-Nature Relations across Time and Space, volume 5: Human-Environment Interactions (Basel: Springer International Publishing, 2016), 234–238.
Etemad Bouda, Luciani Jean, World Energy Production, 1800-1985: Production mondiale d'énergie, 1800-1985 (Genève: Librairie Droz, 1991).
Eurostat, "Energy Balances", available at http://ec.europa.eu/eurostat/web/energy/data/energy-balances.
Eurostat, Economy-Wide Material Flow Accounts and Derived Indicators: A Methodological Guide (Luxembourg: Eurostat, 2001).
Eurostat, Economy-Wide Material Accounts (EW-MFA) (Luxembourg: Eurostat, 2013).
Fischer-Kowalski Marina, Krausmann Fridolin, Giljum Stefan, Lutter Stefan, Mayer Anderas, Bringezu Stefan, Moriguchi Yuichi, Schütz Helmut, Schandl Heinz, Weisz Helga, "Methodology and Indicators of Economy-Wide Material Flow Accounting",Journal of Industrial Ecology, vol. 15/6, 2011, 855–876.
Fischer-Kowalski Marina, Haberl Helmut (eds.), Socioecological Transitions and Global Change: Trajectories of Social Metabolism and Land Use (Cheltenham, UK, Northampton, MA: Edward Elgar, 2007).
Gales Ben, Kander Astrid, Malanima Paolo, del Mar Rubio Maria, "North Versus South: Energy Transition and Energy Intensity in Europe over 200 Years", European Review of Economic History, vol. 11/2, 2007, 219–253.
Gierlinger Sylvia, Krausmann Fridolin, "The Physical Economy of the United States of America", Journal of Industrial Ecology, vol. 16/3, 2012, 365–377.
Grubler Arnulf, "Energy Transitions", in Cutler J. Cleveland (ed.), Encyclopedia of Earth(Washington D.C.: Environmental Information Coalition, National Council for Science and the Environment, 2008, updated 2013). Online version available at https://editors.eol.org/eoearth/wiki/Energy_transitions
Grubler Arnulf, "Energy Transitions Research: Insights and Cautionary Tales", Energy Policy, vol. 50, 2012, 8–16.
Haberl Helmut, "The Energetic Metabolism of Societies. Part I: Accounting Concepts", Journal of Industrial Ecology, vol. 5/1, 2001, 11–33.
Haberl Helmut, "Economy-Wide Energy Flow Accounting", in Heinz Schandl, Clemens M. Grünbühel, Helmut Haberl, Helga Weisz (eds.), Handbook of Physical Accounting: Measuring Bio-Physical Dimensions of Socio Economic Activities. MFA - EFA - HANPP (Vienna: Federal Ministry of Agriculture and Forestry, Environment and Water Management, 2002).
Haberl Helmut, "Human Appropriation of Net Primary Production", in Helmut Geist (ed.),Our Earth's Changing Land: An Encyclopedia of Land-Use and Land-Cover Change (Westport, Conn.: Greenwood Press, 2006), 292–294.
Haberl Helmut, Fischer-Kowalski Marina, Krausmann Fridolin, Winiwarter Verena (eds.), Social Ecology: Society-Nature Relations across Time and Space (Basel: Springer International Publishing, 2016).
Haberl Helmut, Weisz Helga, Amann Christof, Bondeau Alberte, Eisenmenger Nina, Erb Karl-Heinz, Fischer-Kowalski Marina, Krausmann Fridolin, "The Energetic Metabolism of the European Union and the United States. Decadal Energy Input Time-Series with an Emphasis on Biomass", Journal of Industrial Ecology, vol. 10/4, 2006, 151–171.
Henriques Sofia, Energy Transitions, Economic Growth and Structural Change: Portugal in a Long-run comparative Perspective (Lund: Lund University, 2011).
Henriques, Sofia Teives Energy Consumption in Portugal: 1856-2006 (Naples: Istituto di Studi sulle Società del Mediterraneo, 2009).
Henriques Sofia Teives, Karol J. Borowiecki, "The Drivers of Long-Run CO2 Emissions in Europe, North America and Japan since 1800", Energy Policy, vol. 101, 2017, 537–549.
Henriques Sofia Teives, Warde Paul, "Fuelling the English Breakfast. Hidden Energy Flows in the Anglo-Danish Trade 1870–1913", Regional Environmental Change, vol. 18/4, 2018, 965–977.
Hudson Pat, Ishizu Mina, History by Numbers: An Introduction to Quantitative Approaches (London, Oxford, New York, New Delhi, Sydney: Bloomsbury Academic, 2017[2016]).
IEA, "Energy Balances Statistics", available at http://www.iea.org/statistics/topics/energybalances/.
IEA, "World Energy Balances: Overview 2017", available at http://www.iea.org/publications/freepublications/publication/WorldEnerg….
IEA, Key World Energy Statistics(Paris, 2017).
Joint Center for History and Economics, Harvard University, "National Energy Accounts: Sources, Methods, and Citations", available at https://sites.fas.harvard.edu/~histecon/energyhistory/sources.html.
Kander Astrid, Economic Growth, Energy Consumption and CO2 Emissions in Sweden 1800-2000 (Stockholm: Almqvist & Wiksell International, 2002).
Kander Astrid, Malanima Paolo, Warde Paul (eds.), Power to the People: Energy in Europe over the Last Five Centuries (Princeton: Princeton University Press, 2013).
Kander Astrid, Warde Paul, "Number, Size and Energy Consumption of Draught Animals in European Agriculture. Working Paper 2009", available at http://www.histecon.magd.cam.ac.uk/history-sust/files/warde_kander_work….
Kander Astrid, Warde Paul, "Energy Availability from Livestock and Agricultural Productivity in Europe, 1815-1913. A new comparison", The Economic History Review, vol. 64/1, 2011, 1–29.
Krausmann Fridolin, "A City and Its Hinterland: Vienna’s Energy Metabolism 1800–2006", in Simron Jit Singh, Helmut Haberl, Marian Chertow, Michael Mirtl, Martin Schmid (eds.), Long Term Socio-Ecological Research: Studies in Society-Nature Interactions Across Spatial and Temporal Scales (Dordrecht: Springer Netherlands, 2013), 247–268.
Krausmann Fridolin, Erb Karl-Heinz, Gingrich Simone, Haberl Helmut, Bondeau Alberte, Gaube Veronika, Lauk Christian, Plutzar Christoph, Searchinger Timothy D., "Global Human Appropriation of Net Primary Production Doubled in the 20th Century", Proceedings of the National Academy of Sciences of the United States of America, vol. 110/25, 2013, 10324–10329.
Krausmann Fridolin, Erb Karl-Heinz, Gingrich Simone, Lauk Christian, Haberl Helmut, "Global Patterns of Socioeconomic Biomass Flows in the Year 2000: A Comprehensive Assessment of Supply, Consumption and Constraints", Ecological Economics, vol. 65/3, 2008, 471–487.
Krausmann Fridolin, Fischer-Kowalski Marina, Schandl Heinz, Eisenmenger Nina, "The Global Sociometabolic Transition: Past and Present Metabolic Profiles and their Future Trajectories", Journal of Industrial Ecology, vol. 12/5-6, 2008, 637–656.
Krausmann Fridolin, Gingrich Simone, Eisenmenger Nina, Erb Karl-Heinz, Haberl Helmut, Fischer-Kowalski Marina, "Growth in Global Materials use, GDP and Population during the 20th Century", Ecological Economics, vol. 68/10, 2009, 2696–2705.
Krausmann Fridolin, Gingrich Simone, Nourbakhch‐Sabet Reza, "The Metabolic Transition in Japan", Journal of Industrial Ecology, vol. 15/6, 2011, 877–892.
Kuskova Petra, Gingrich Simone, Krausmann Fridolin, "Long Term Changes in Social Metabolism and Land Use in Czechoslovakia, 1830–2000: An Energy Transition under Changing Political Regimes", Ecological Economics, vol. 68/1-2, 2008, 394–407.
Maddison Angus, Monitoring the World Economy, 1820-1992 (Paris: OECD Development Centre, 1995).
Malanima Paolo, Energy Consumption in Italy in the 19th and 20th Centuries: A Statistical Outline (Naples: Consiglio Nazionale delle Ricerche, 2006).
Mitchell Brian R., British Historical Statistics (Cambridge: Cambridge University Press, 1988).
Mitchell Brian R., International Historical Statistics: 1750-2005 (Basingstoke: Palgrave Macmillan, 6thed., 2007).
OECD, IEA, Eurostat, Energy Statistics Manual (Paris, 2005).
Pallua Irene, Historische Energietransitionen im Ländervergleich: Energienutzung, Bevölkerung, Wirtschaftliche Entwicklung (Vienna: IFF-Social Ecology, 2013).
Podobnik Bruce, "Toward a Sustainable Energy Regime", Technological Forecasting and Social Change, vol. 62/3, 1999, 155–172.
Podobnik Bruce, "Global Energy Inequalities: Exploring the Long-Term Implications", Journal of World- Systems Research, vol. VIII/2, 2002, 252–274.
Podobnik Bruce, Global Energy shifts: Fostering Sustainability in a Turbulent Age (Philadelphia, Pa.: Temple Univ. Press, 2006).
Singh Simron Jit, Krausmann Fridolin, Gingrich Simone, Haberl Helmut, Erb Karl-Heinz, Lanz Peter, Martinez-Alier Joan, Temper Leah, "India's Biophysical Economy, 1961-2008. Sustainability in a National and Global context", Ecological Economics, vol. 76, 2012, 60–69.
Smil Vaclav, Energy Transitions: History, Requirements, Prospects (Santa Barbara, Calif.: Praeger, 2010).
Sovacool Benjamin K., "How Long Will It Take? Conceptualizing the Temporal Dynamics of Energy Transitions”, Energy Research & Social Science, vol. 13, 2016, 202–215.
United Nations Statistics Division, "International Recommendations for Energy Statistics (IRES)", available at https://unstats.un.org/unsd/energy/ires/IRES-web.pdf.
Warde Paul, Energy Consumption in England and Wales, 1560-2000 (Naples: Consiglio Nazionale delle Ricerche, 2007).
Warde Paul, "Energy Embodied in Traded Goods for the United Kingdom, 1870-1935. Discussion of Methods and Sources", available athttps://histecon.fas.harvard.edu/energyhistory/British_energy_multiplie…
Weisz Helga, Krausmann Fridolin, Eisenmenger Nina, Schütz Helmut, Haas Willi, Schaffratzik Anke, Economy-Wide Material Flow Accounting. A Compilation Guide (Luxembourg: Eurostat, European Commission, 2007).